Member-only story
A curated list of “Top” based monitoring tools for use in Linux and Unix terminals.
*I initially made this article only including those tools with top in their name but given this excludes many other great tools, I have relaxed this.
Over the years several terminal-based tools have emerged for real-time monitoring of UNIX/Linux servers with respect to hardware related metrics such as Memory, CPU, Swap usage alongside process viewing and management. More specific ones have also been developed for monitoring containers, network, GPUs, as well as workload managers. These are all built for use from the terminal and have been invaluable in our debugging endeavours.
It is important not to forget before you move onto centralised monitoring tools like Prometheus, Datadog, Elastic etc… these tools will be the precursor MVPs when you're on the spot developing.
All these tools follow a Top naming convention and several have been developed, each with a unique look and utility. Here is a categorised list and links to their respective git repositories. Take a moment to star the repo and appreciate the people developing these tools.
If you want to install any of the top tools below please google “ how to install <top monitoring tool> in linux” or just try a “sudo apt install <top monitoring tool>” for our apt-based users.
So what are the Top tools out there?
Top General Hardware/Process Monitoring (the all-rounders):
top …you know the original otherwise, you wouldn’t be here.
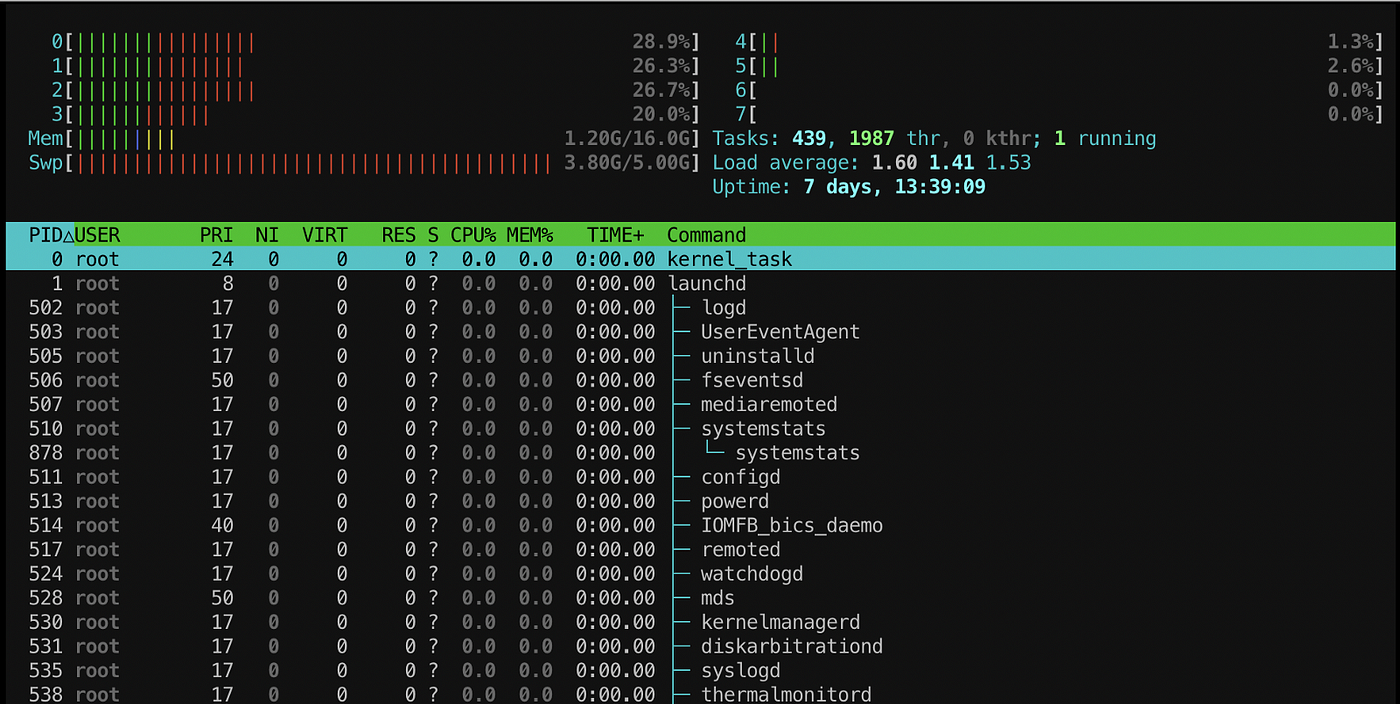
htop https://github.com/htop-dev/htop
bpytop https://github.com/aristocratos/bpytop
btop https://github.com/aristocratos/btop
bashtop https://github.com/aristocratos/bashtop
atop https://github.com/Atoptool/atop
vtop https://github.com/MrRio/vtop
gtop https://github.com/aksakalli/gtop
gotop https://github.com/xxxserxxx/gotop
ytop https://github.com/cjbassi/ytop
treetop https://github.com/turbo/treetop